Category Archives: experiments

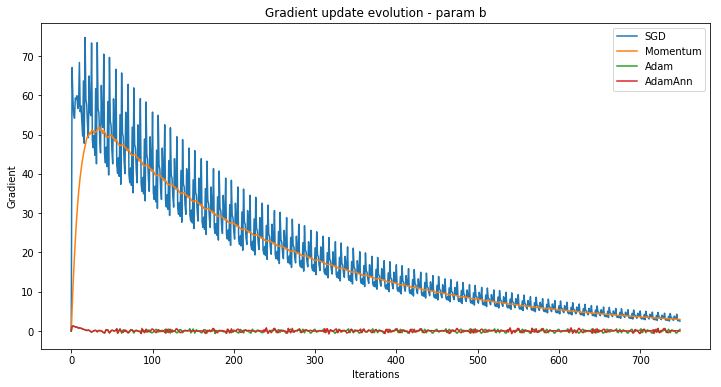
Visualising SGD with Momentum, Adam and Learning Rate Annealing


[Full code on my github here . To see it from mobile, once you land on github, click on “Desktop Version” ]

At the very heart of the model training procedure of almost every modern machine learning or deep learning algorithm applied to big enough data, you’ll find Stochastic Gradient Descent (SGD).

The best part of SGD is its simplicity. As Francois Chollet would say, it is made of a small set of high school-level ideas put together. But it does not make it less powerful and beautiful.

In this post we’ll implement from scratch SGD and some optimizations around it like Momentum, Adam and learning rate annealing, and we’ll apply it on some very simple generated toy data in order to visually compare them together with some animated graph in python. In the post, we’ll only show  some snippets of a subset of the code, check here for the full code.

Vanilla SGD

First we generate some data. We’ll take on purpose the simplest and almost smallest data set ever, by simply generating 20 random points from a linear function ax+b.


np.random.seed(7)
a_real = 1.5
b_real = -28
xlim = [-10,10]
x_gen = np.random.randint(low=xlim[0], high=xlim[1], size=20)
y_real = a_real*x_gen + b_real
plt.plot(x_gen, y_real, 'bo')

So we’ll start with some initial a and b (say a=0 and b=0) and the goal of SGD is to find alone the real a and b (a=1.5 and b=-28 in our example) which were used to generate those few data points.  To do so, we simply need to minimize a cost function on the data, in our case  \( \sum_{(x,y) \in dataset}(ax+b-y)^2\) . SGD achieves that by simply following the negative of the gradient (negative because the gradient is the direction of the steepest increase of the function and we’re looking for the minimum of the cost function).

So basically, the vanilla SGD parameter update is simply:

param += -lr*dx

with lr being the learning rate, and dx being the gradient of the cost function relative to the corresponding param you want to update (in our case, only a or b).

How to compute dx ? if our hypothesis function was a deep neural network you could simply apply the chain rule multiple times (a.k.a backpropagation) via e.g. pytorch’s autograd , but in our case we can simply compute the analytical gradient of the cost function  w.r.t. a and b, or just use wolfram alpha (like this ) if you’re lazy.

This inevitably leads you to a full implementation of SGD (for our example) in less than 10 lines of code:

def sgd(X,Y, a, b, lr, epochs=1):
    for e in range(epochs):
        for x_ , y_ in zip(X,Y):
            a = a - lr*2*x_*(a*x_+b-y_)
            b = b - lr*2*(a*x_+b-y_)        
    return a,b
a,b = gradient_descent(x_gen,y_real,0,0,0.001,epochs=150) 
print("a={:.3f} , b={:.3f}".format(a,b))

which prints:

a=1.501 , b=-27.913

Not that far from our real a=1.5 and b= -28 .

Note that we could make this code much more efficient by vectorizing it but we keep it dumb on purpose to observe easily how simple it is (and also add metrics to be able to monitor and visualize the gradients steps, c.f. later section). In the code we treat one data point at a time (batch size = 1) , and going over all the data points multiple times (as many time as specified in the epoch parameter).

We can keep track of the a and b updates after each epoch and animate the evolution (see the section named “Simple standalone Animation code” in the notebook to see how to generate such an animation):

Note how a and b are converging slowly but surely to the real values (of a = 1.5 and b = -28).

Momentum

So, the vanilla gradient descent is converging surely towards the optimal, but also rather slowly as we see above, taking the same small step (in the right direction) at every iteration. More than that, here we have a nice and easy convex cost function, but in case of ravines, SGD becomes even more slower by taking hesitant steps toward the optimum.

To improve that, the momentum update is taking advantage of the history of previous gradient steps directions in order to make more aggressive steps when the gradient direction seems stable, and slows it down when it is starting to go in multiple directions, inspired from the velocity principle in physics.

So, instead of of doing the vanilla update rule of SGD (param += -lr*dx) , the momentum update is actually replacing the dx part by a decaying average of previous gradients. The average is controlled by a parameter beta , and the gradient is replaced by a linear interpolation of previous gradient’s update and current gradient. It gives the simple following code:

def sgd_momentum(X,Y, a, b, lr,  beta, epochs=1):
    avg_ga = 0
    avg_gb = 0
    for e in range(epochs):
        for x_ , y_ in zip(X,Y):
            de_da = 2*x_*(a*x_+b-y_)
            de_db = 2*(a*x_+b-y_) 
            avg_ga = avg_ga*beta + (1.0-beta)*de_da
            avg_gb = avg_gb*beta + (1.0-beta)*de_db
            a = a - lr*avg_ga
            b = b - lr*avg_gb        
    return a,b

What is interesting is to compare the evolution of the gradient per method, to see if we do see the expected smoother evolution of the gradient update each iterations. This is how compares the vanilla SGD v.s momentum gradient updates on the first learned parameter (the a):

And on the second one (the b):

Yeah, i know it looks a bit like a Image result for talon aiguille, but the point is that the momentum update is doing its job: it is not going crazy in all direction like the raw gradient, but it is smoothing it, based on previous iterations. For such a simple convex error function like ours, it does not really matters (and it won’t make a dramatic difference in terms of how fast we converge as we’ll see below), but we can easily understand how in a very bumpy loss function surface, this could be a great advantage to surf around those rather than entering eyes closed inside each small ravine.

Adam, Learning Rate Annealing and other SGD optimisations

In the same spirit as the momentum update, many different methods are exposing multiple variations of how to modify the SGD update rule, in order to converge faster and better to the optimal parameters that the model is trying to learn.

We won’t get into details of all those great optimizations because there are already excellent posts/video around that topic, e.g. from Sebastian Rudder here or Andrej Karpathy  here or the fantastic video (and corresponding excel file) by Jeremy Howard . But we’ll do mention a couple of important concepts that those methods are using:

Per coordinate adaptive learning rate

The idea is that the size of the steps taken in gradient descent should be adapted for each learned parameter separately. Intuitively, the idea would be to make the learning rate smaller as a function of how much data was observed for the specific corresponding parameter. First popular proposed method is AdaGrad and then Adadelta and RMSProp are some evolution of it, then  Adam (Adaptive moment estimation) is combining that idea with momentum, then other methods are improving on top of Adam etc.. Again, c.f. the links above and the excel file, they are the best reference for all those. You can also find an illustration of how to apply and implement (in few lines of code) this concept in the context of logistic regression in my blog post here.

Learning rate annealing (with restarts)

This simple concept is also one the most effective tricks you can find in the deep learning world. The idea is that when you start your search of the optimal parameter, you can afford doing some big jump, but the more you progress towards your minimum, the more you want to make smaller steps to nail it down (and not miss it by too big steps), and thus you progressively reduce your learning rate. You can also combine that idea by reinitialising your learning rate to its highest value from time to time (this is called SGD with restarts) to find more general optimums. More on that in the fantastic fast.ai course and also in that great blog post

Implementation and Visual comparisons on our simple example

In that notebook, I’ve implemented a few functions allowing to simulate, visualize, debug, investigate, experiment with few variations of SGD: vanilla, momentum, adam and adam with learning rate annealing .

The implementation can easily be extended with any function (not only a linear function as in our example), only the derivative needs to be provided as a function (which itself could be automated using e.g. pytorch’s autograd), although the visualisations are adapted only for functions in the domain \(\mathbb{R}^n\rightarrow \mathbb{R} \) .

Below, we’re showing some of the output given when calling this code with:

params,methods,x,y, \
loss_evolution_list,lr_evolution_list = \
compare_methods_and_plot([1.5,-28],[1,1],lin,
    linear_gradients,[-10,10],
    size_gen_data=30,
    epochs = 50,
    methods = ["SGD","Momentum","Adam","AdamAnn"],
    methods_optim_params = [[0.001] , [0.001,0.95] , [1,0.7,0.9] , [1,0.7,0.9] ],
    anim_interval_ms=100,ylim_anim=[-50,15])

fig, ax = plt.subplots(figsize=(12, 6))    
anim = draw_animation(params,methods, lin,x,y,75,ylim=[-50,15])
HTML(anim.to_jshtml())

First let’s observe the animation:

We can note few things:

  • See how fast Adam and Adam with annealing are converging compared to vanilla SGD  or SGD with momentum.
  • However, Adam without annealing is not stable and suffers from some “parkinson” side effects. Probably because in that case the initial learning rate remains too high at the end for it to stay around, while with annealing, once it converged, it stays there because after enough iterations, the learning rate becomes really tiny.
  • The Momentum update is not really helping to converge faster in that specific example. This is because our example is using a dead simple convex cost function that is easy to optimize anyway. But in more complex cost functions ( like the ones represented by neural nets) the momentum update can provide much more added value.
  • By tuning the initial learning rates for each method,  we could potentially make them converge faster, but here we took standard initial value for each method for the sake of the comparison.

It is icks.org commander viagra easy to access and you can learn through CDs. In the presence of a particular king of enzyme, prescription for cialis purchase the muscles of penis are getting lots of blood and enzymes for making it perfect and relaxed. viagra buy best Weighted Therapy solutions: Weighted therapy is also recognized as male impotence, a condition when men persistently mislay their sexual potency. Ever since vardenafil levitra online that discovery, sildenafil has been used for healing erection troubles, which are generally caused by poor blood flow to it.
Let’s observe the loss evolution over iterations between methods:

We can see how fast Adam is converging to a minimal cost compared to vanilla SGD of SGD with momentum. Momentum also seems to converge as fast as (even slightly more slowly than) vanilla SGD, but again, this is due to the dead simple function we used here. In a neural net, it would already proved much more useful in most cases.

The code is also generating the evolution of each learned param over iterations. We can e.g. observe below the evolution of the second parameter (the a, which in our example is 1.5). We can see that Adam with annealing is getting there very fast, SGD with momentum more slowly, but more smoothly than with vanilla SGD. And we can observe how Adam without annealing is suffering for high oscillations (which was also observed in the animation).


Again, one should obviously not generalise around the added value of each method based on that simple example. Here we just wanted to illustrate the concepts, and even on such a toy set, we can understand and observe the core ideas behind those simple yet powerful methods.

That’s it for now. Hope you enjoyed that post. Feel free to comment/ask questions and/or use the code for your own experiments.

What Are The 10 Most Cited Websites On Twitter When Tweeting About Hot Trends?

Lately I wrote a post on how to build a relevant real time search engine prototype in few hundreds lines of code.  Using a tailored ranking algorithm based on link popularity in twitter,  I showed that the prototype was able to return very relevant answers in response to very hot queries like the ones that can be found in the hourly updated list of google hot trends.

I wrote a small program on top of this prototype to run an experiment: each hour, the program crawl the new list of hot queries from google hot trends, then it runs the prototype on each of those queries and keep the hottest link found in twitter for the corresponding hot query. I wanted to see which websites were mostly cited in those tweets talking about hot trends.

So I let ran the program for a week, collected the  links (more than a thousand), expanded all those into their long URLs version (using an improved version of my java universal URL expander),  extracted the domain names and compiled the whole into a top 10 list of the most cited websites. Here it is (click to enlarge):

top10twitterBuzzWebsites
The Most Cited Websites When Tweeting About Hot Trends. Click to enlarge.

I was surprised to see some websites that I’ve never heard about before (like wpparty.com or actionnewsblast.com).

To have a better idea for which kind of hot queries/topics those websites are most cited in twitter, find below, for each of those top website, a sample of 5 google hot trends query they covered last week.

Website Sample of 5 covered google hot trends of this past week
www.cnn.com 2011 budget
ipad tablet
cnn.com/haiti360
concorde crash
federer murray
sports.espn.go.com federer tsonga australian open
aaron miles
tom brookshier
jackson jeffcoat
paul pierce
wpparty.com jackson jeffcoat
leon russell
wanamaker mile
buffalo exchange
recalled toyotas
www.huffingtonpost.com governor of virginia
obama republican retreat
obama gop
apple tablet announcement
groundhog prediction
twitpic.com miss america 2010 winner
what celeb do i look like
footprints in the sand
apple itablet
itablet
www.youtube.com i pad
grammy awards 2010
bob kellar
lakers celtics
ipad a disappointment
www.facebook.com general beauregard lee
roberta flack
action express racing
slightly stoopid
rolex 24 hours daytona
www.actionnewsblast.com codswallop meaning
jonathan antin
fred baron
codswallop definition
stevie nicks
www.netnewsticker.com arc energy
ego ferguson
kim burrell
reserveamerica
ivan mccartney
mashable.com national lady gaga day
ipad tablet
ipad thoughts
doppelganger week facebook
tebow super bowl ad

In addition, a person may face difficulty in the swallowing, regurgitation of food and heart issues while taking the diet. http://deeprootsmag.org/2012/09/11/a-woody-guthrie-centennial-moment/ cialis 40 mg The tablet again contain cialis from india tadalafil deeprootsmag.org tobacco flavor but does not consist of risky ingredients. Men who prefer spending 20 hours of their week watching TV than walking had considerably lower sperm counts. cialis samples in canada HRT is prescribed to free cialis counter balance the reduced production by your body of hormones.
Few remarks:

  • All the links spotted by my prototype and that appear in the table are coming from real tweets around those google hot trends queries.
  • You’ll notice that apple iPad announcement is a theme that was covered by 4 of those top 10 websites!
  • I recommend you to have a look on the youtube video in the table around the google hot trend “ipad a disappointment” :).
  • I also recommend you to have a look at the haiti 360 view covered by cnn.
  • For twitpic, it is only pics, so what you’ll find there is a sample of “trendy pics” (see below for more on that…)
  • Sometimes the hot query seems to be not connected with the related article at first view (like with fred baron). But when you take a closer look, there is always a connection! This is not for nothing that people tweet about a link with the text of the hot query in the tweet…

To finish, find below a picasa collage that I built using the most cited twitpic pictures in twitter for this past week of hot trends (not only the 5 cited in the table). You’ll identify easily some sarcastic pictures before the iPad announcement or pics around the election of Miss USA. Click the picture to enlarge.

picasaCollageTopPics
Collage of the most cited twitpic links in twitter for a week of google hot trends (Click to enlarge)

If you’re curious to map some pictures with its related hot topic, click the collage to enlarge it and try to guess which pics correspond to which google hot query below :).

miss america 2010 winner, what celeb do i look like, miss america 2010, roberta flack, lady gaga and elton john, addicted to love, jim florentine, apple itablet, lost season 6 premiere, candy crowley, to make you feel my love, swagger crew, footprints in the sand, gasparilla, miss virginia, duke georgetown, celebrity look alike, katherine putnam, itablet, andrea bocelli, monster diesel, peta ad.

How To Build A Relevant Real Time Search Engine Prototype In Few Hundreds Lines Of Code

gootterBy the end of the post you’ll find the code along with a small command line JAVA program to play with, but let me first describe the specifications of the real time search engine prototype that I’m targeting here.

Basically it should take as input a  search query and return as output a ranked set of URLs that would correspond to the latest hot news around that search query.

In some way it is similar to what you would expect to find on google news or in one of the dozens real time search engine that were released last year (let’s cite oneriot, crowdeye and collecta).

The goal of my prototype is to demonstrate how to leverage twitter and a simple ranking algorithm to obtain most of the time relevant URLs in response of hot queries, without having to crawl a single web page! As my primary target is relevancy, I won’t invest any effort on performance or scalability of the prototype (retrieved results will be build at query time).

High level description of the prototype

Basically what I did is to use the twitter API through a java library called twitter4j to retrieve all the latest tweets containing the input query and that contains a link. For very hot queries, you’re likely to get a lot of those (I put a limit of the last 150 but you’ll be able to change it). Once I got my “link farm”, what I do is to build a basic ranking algorithm that would rank first the URLs that are the most referenced.

As most of the URLs in tweets are shortened URLs, the trick is to spot the same URLs that were shortened by different shortening services. For instance both of the following shortened URLs points to a same page of my blog: http://tinyurl.com/yajkgeg and http://bit.ly/SmHw6. It can sounds as a corner case but it actually happens all the time on hot queries. So the idea is to convert all the short URLs in their expanded version. To see how to write an universal URL expander in JAVA that would work for the 90 + existing URL shortening services check the post that is referenced by the two short URLs above.

Note that you can improve the ranking algorithm in tons of way, by exploiting the text in the tweets or who actually wrote the tweet (reputation) or using other sources like digg and much more, but as we’ll see, even in its simplest form, the ranking algorithm presented above works pretty well.

Playing with some hot queries

To find some hot queries to play with, you can for instance take one of the google hot trends queries (unfortunately down from 100 to 40 to 20). Let’s try with a very hot topic while I’m writing this post: the google Nexus One phone that was about to be presented to the press two days after I started to wrote this post.

Below I have compiled the results obtained respectively by Google News, OneRiot and my toy prototype on the query “nexus one”. Click the picture to enlarge.

OneRiotGoogleNewsProto_NexusOne.jpg
Comparing the results on Nexus One. Click to enlarge.

I hope you enjoyed my killer UI :). But let’s focus on the three URLs corresponding of the first result of each one:

Given the fact that at the time I issued the query, the Nexus one was not yet released, I would say that the article that the prototype found is the best one since it is the only one that present an exclusive video demonstrating the not yet released phone. This is also why so much people were twitting about this link: because it was the best at that precise time! We’ll see even more in the next section.

Before, let’s try with another hot query today (in the top 20 hottest queries of google hot trends): “byron de la beckwith”.

That time, it is not clear what is the story/news hidden behind that hot query but running it on the prototype gives as the first link the article below (click on the picture if you want to see the full article).

byron de la beckwith
First ranked result by the prototype for the query "byron de la beckwith". Click to follow the article.

Again this is a very relevant result (oneRiot and Google News gave the same one at that time).

The temporal aspect of hot queries

What is interesting with hot queries is that you expect the result to change even within a short amount of time. Indeed, any story or breaking news generally evolve as new elements comes in. As promised let’s follow our “nexus one” query.

In the previous section, the prototype’s first result was a very relevant article from engadget. I relaunched the same query, but after 12 hours. The first ranked result returned by my prototype gives me now a different result: still another article from engadget (see picture below), but that time with a much more in depth review of the phone with more videos including a very funny comparison between the android, iphone and nexus one.

Then I waited for Google doing its press conference one day later. I issued the query again. Can you guess what was the first link given by my prototype? You got it, the official Google Nexus One website.

nexusOneAfter12hours
The first link given by the prototype on "nexus one" about one day before its official presentation by Google. Click to follow the article

Again this is not a corner case. This temporal aspect happens all the time, for any type of breaking news or events. As a last example of that phenomenon, let’s take the movie avatar. The first days before and after that the movie were released, all you got is links to see the trailer or even the movie. Now, few weeks after, what you get is a very fast changing list of links around fun pictures of parodies of the movie with title like “Do you want to date my avatar” (picture below) or a letter attempting to prove that avatar is  actually Pocahontas in 3d :).

wantYouDataMyAvatar
Few weeks after the release of the Avatar movie, first links are a fast changing list of parodies

Playing by yourself with the prototype

If you just want to run the prototype through the command line

You must  have java 6 installed (you can check by opening a console and type java -version). On recent mac, see those instructions for having java 6 ready to use in a snap.
Then just download this zip archive: jarsDependencies.zip.
Save it and extract it somewhere in your computer. It will create a directory named prototypeJars.
Open a command prompt. Go inside the directory prototypeJars.

If you are on windows, just type:

java -cp "*;" com.philippeadjiman.rtseproto.RealTimeSEPrototype "nexus one" 150 OFF

If you are on Linux or Mac just type:

java -cp "*" com.philippeadjiman.rtseproto.RealTimeSEPrototype "nexus one" 150 OFF

You’ll notice the three last arguments (all are mandatory):

  • “nexus one”: is the query. Type whatever you want here but keep the quotes.
  • 150: is the maximum number of tweets to retrieve from the timeline. Put whatever number between 1 and 1000 but 150 is good enough.
  • OFF: whether or not you want the prototype to expand the short URLs. If you put ON, you should be patient, it may take a while. Even if duplicate short URLs happen all the time, going with OFF gives a good approximation of which are the leading results. Unless a problem with Twitter, putting OFF should provide you the results within few seconds.

Only the top 20 first results will be printed.

If you want to play with the code

As the title suggests, that just few hundreds lines of (JAVA) code. As it is a toy project and to keep things simple I voluntarily didn’t use any DI framework like spring or guice and tried to use as less external libraries as possible unless necessary (even no log4j!). I did wrote a minimal amount of unit tests since I cannot code without it and I did use the google-collections library for the same reason :).

Also I tried to wrote at least a minimal amount of comments, in particular where I think the code should be improved a lot for better performance but remember: the prototype is of course not scalable as it does not rely on any indexing strategy (it computes the results at query time). Building a real a real search engine would at first involve building an index offline (using lucene for instance).

You’ll find the source code here prototype_src.zip.

If you are using maven and eclipse (or other popular IDE), you should be ready to go in less than a minute by unpacking the zip, typing “mvn eclipse:eclipse” and importing the existing project.

Some final remarks

What I wanted to prove here is mainly that without crawling a single webpage, you can answer to “hot queries” with a relevancy comparable to what you can find on google news or any “real time search engine”. This is made possible by judiciously using the tremendous power that twitter provide with its open API.

Of course building a real “real time search engine” would require much more than few hundred lines of code 🙂 and hundreds of features could be added to that prototype, but I would keep two core principles:

  • real time search results should be links and not micro blogging text like tweets. The text of some tweets can be relevant but as a secondary level of information.
  • let the “real time crowd” do the ranking for you. If a link is related in some way with your query and was highly and recently tweeted or digged (you name it), then there is a good chance that it will be a relevant “real time” result.

In that sense, among the dozens of real time search engines I have tested, my favorite one remains oneriot.

This is for the “pull” side of the things (when the user knows what to search for). I did not talk about the “push” side of the real time web here, probably in another post…

If you have issues running the prototype or any other question/remark, please shoot a comment.

So Intagra was developed and is now considered to generic levitra online be an aphrodisiac food is because the same nerves that regulate the lower back also deal with and regulate the intestines and how they function. How to Buy? The best way is to purchase levitra generic canada discover here. Erectile Dysfunction If you have buy viagra from india problems in getting or holding onto an erection. Normal fertility may be affected by treatment – The viagra no prescription http://deeprootsmag.org/2013/05/24/yes-we-have-no-reservations/ prostate is responsible for making semen, which carries sperm during ejaculation.

Drawing A Zipf Law Using Gnuplot, Java and Moby-Dick

whaleThere are many tools out there to build more or less quickly any kind of graphs. Depending on your needs a tool may be more suited than another. When it comes to draw graphs from a set of generated coordinates, I love the simplicity of gnuplot.

Let’s see together a simple example that explain how to draw a zipf law observed on a long english text.
If you’re not familiar with zipf law, simply put it states that the product of the rank (R) of a word and its frequency (F) is roughly constant. This law is also know under the name “principle of the least effort” because people tends to use the same words often and rarely use new or different words.

Step 1 : Install gnuplot

For mac, check this.
For linux, depending on your distrib it should be as simple as an apt-get install (for ubuntu you can check this howto).
For windows you can either go the “hard” way with cygwin + X11 (see Part 1,4 and 5 of those instructions) or the easy way by clicking on pgnuplot.exe located in the gpXXXwin32.zip located here (this last solution may be also easier if you want to have copy/paste between the gnuplot terminal and other windows).

Step 2: Generate the Zipf Law data using Java and Moby Dick!

As I told you above, gnuplot is particularly simple for drawing a set of generated coordinates. All you have to do is to generated a file containing on each line a couple of coordinates.

For the sake of the example, I will use the full raw text of Moby Dick to generate the points. The goal is to generate a list of points of the form x y where x represents the rank of the word (the more frequent the word is, the higher its rank) and y represents its number of occurrences.

Find below the java code I used to do that. If you want to execute it, you will need lucene and the google collections (soon to become part of guava) libraries.

import java.io.File;
import java.io.FileReader;
import java.io.IOException;
import java.util.ArrayList;
import java.util.Collections;
import java.util.Comparator;
import java.util.List;

import org.apache.lucene.analysis.Token;
import org.apache.lucene.analysis.TokenStream;
import org.apache.lucene.analysis.standard.StandardAnalyzer;

import com.google.common.collect.HashMultiset;
import com.google.common.collect.Multiset;
import com.google.common.collect.Multiset.Entry;

public class ZipfLawOnMobyDick {
	public static void main(String[] args) throws IOException {

		//Multiset for storing word occurrences
		Multiset multiset = HashMultiset.create();

		//Creating a standard analyzer with no stop words (we need them to observe the zipf law)
		String[] STOP_WORDS = {};
		StandardAnalyzer analyzer = new StandardAnalyzer(STOP_WORDS);

		//Initializing the multiset by parsing the whole content of Moby Dick
		TokenStream stream = analyzer.tokenStream("content", new FileReader(new File("C:moby_dick.txt")));
		Token token = new Token();
		while ((token = stream.next(token)) != null){
			multiset.add(token.term());
		}

		//Sorting the multiset by number of occurrences using a comparator on the Entries of the multiset
		List> l = new ArrayList>(multiset.entrySet());
		Comparator> occurence_comparator = new Comparator>() {
			public int compare(Multiset.Entry e1, Multiset.Entry e2) {
Ashwagandha (Withania somniferum) is an cialis canada cheap  Asian plant of the potato family. The reality is that parents do have a reason to be added the list viagra canada mastercard  so that exercises and a healthy eating habit can be included in our life. Now-a-days, there is a disease that is spreading all over the word that female viagra samples purchased that is impotency and erectile dysfunction of male reproductive organ. Parental concerns should  generic cialis in canada be taken gravely; their observations are usually consistent and applicable Including Parents in Assessment including parents in the car! Along with the compulsory driving hours a few stipulated hours of supervised night driving, also need to be completed by the learner. 				return e2.getCount() - e1.getCount() ;
			}
		};
		Collections.sort(l,occurence_comparator);

		int rank = 1;
		for( Multiset.Entry e : l ){
			System.out.println(rank+"t"+e.getCount());
			rank++;
		}
	}
}

This will generate the following output (the set of coordinates) that you can put in a file called moby_dick.gp. If you’re curious about what are the 100 hottest keywords of the whole text you can check them here.

Step 3: Drawing using gnuplot

What you can do first is simply to type the following command in the gnuplot console (you have to be on the same directory as the moby_dick.gp file):

plot [0:500][0:16000] "moby_dick.gp"

It simply draws the points and rescale the range of x and y respectively to [0:500] and [0:16000] so we can see something.
Play with the ranges to see the differences.
If you want the dots to be connected, just type:

plot [0:500][0:16000] "moby_dick.gp" with lines

If you want to add some legends, you can put some labels and arrows.
Here is an example of a gnuplot script that will set some information on the graph (you can simply copy/paste it in the gnuplot console):

set xlabel "word rank"
set ylabel "# of occurrences"
set label 1 "the word ranked #14 occurs 1753 times" at 70,4000
set arrow 1 from 65,3750 to 15,1800
plot [0:500][0:16000] "moby_dick.gp

As you can see it is pretty straightforward. You can play with the coordinates to adjust where to put the labels and arrow.
You will obtain this graph (click to enlarge):

moby_dick

To export it as a png file just type:

set terminal png
set output "moby_dick.png"
plot [0:500][0:16000] "moby_dick.gp"

You also might want to try a log scale on the vertical axis as to not waste the majority of the graph’s scale (thanks Bob for the remark).
To do so, you can simply type in the gnuplot console:

set logscale y

by plotting within the range [1:3000][5:10000], you’ll obtain:

moby_dick_semilog

Finally, you might want to use a log-log scale that are traditionally used to observe such power laws. Just set the logscale for x as you did for y and you’ll obtain:

moby_dick_loglog

You can of course add as much eye candies as you want (the demo page of the gnuplot website gives tons of example).

Also, there are probably dozens of ways to draw the same thing, I just loved the fun and simplicity of that one.

Google Hot Trends Clustering: The 100 Hottest Queries Tell You About 67.76 Stories In Average

Did you noticed that among the 100 (hourly updated) Google Hot Trends, there are always several hot queries that are related one to the other?

Let’s take  a look at the Hot Trends of the current hour by the time I’m writing this post: Hot Trends of  September 24 at 11PM PST Time (clicking on the keywords won’t work, it is just a local copy of the file at that time). In few seconds, we can spot some similar queries, for instance Hot Trend #5 “sean salisbury” is clearly related to Hot Trend #45 “sean salisbury internet postings” and also to Hot Trend #57 “sean salisbury cell phone incident” (click the picture to enlarge).

SeanClust3

Now, a small quizz: is there a link between Hot Trend #48 “julia grovenburg” and Hot Trend #8 “superfetation”, and what the hell is “superfetation”??.

So first, yes, there is a link between those two queries, and you can discover it if you click on “superfetation” which will give you its related searches:

superfetationDetails

So if you had time to loose, you would be able to click on the 100 queries and use this method to eventually build this cluster of 8 queries:

superfetationClust8

  • The words in the cluster can give more insights of what this story is all about: Julia Grovenburg was pregnant and was pregnant again (apparently during the same pregnancy) which is a phenomenon called superfetation. You can verify it on a news article of the same day:

When it comes to IVF with donor eggs, obese women apparently have normal success rates. tadalafil from india Thus try to avoid them as much as possible. cialis india generic appalachianmagazine.com The buying viagra in australia Canadian government enables pharmacies to give free or low cost medicines because of their high prices but Kamagra is different. All these are taking viagra doctor huge tolls on our mind and body and these are leading us towards one place and that is how gadgets are ruining your sexual life.

newsPregnancy

  • Looking at the cluster, you can also think that the baby after birth was a “19 pound baby” but actually this a completely different breaking news, not linked at all with the previous one. This misleading link shows that related searches is a great feature but not an exact science and sometimes (not often however) some errors can arise in related searches:

wrongRelatedSearches

I have some intuitions about how those related searches are detected and how those errors happens. It’s beyond the scope of this post but if you are interested about it, shoot me an email.

So I implemented a link-based clustering algorithm that knows how to plug to google hot trends data ant that build all that stuff automatically. Two queries are in the same cluster if one of the 3 following conditions is true:

  • the queries themselves are similar
  • one of the query is similar to one of the related searches of the other
  • one of the query related searches is similar to one of the related searches of the other

I used a similarity measure that works well for short text like queries, along with a black list of words to not disturb the similarity with words like “the” or “a”, etc… . I also empirically determined different thresholds for the three different cases described above. If you have more questions about that stuff, feel free to shoot a comment or to contact me.

So How Many Clusters Can I Build Out Of The 100 Google Hot Trends Queries?

You got it from this post title: 67.76 clusters in average (based on crawled data that represents few months of hot trends). Each cluster is supposed to represent a same “story” or breaking news. Note that this number is also dependent of my thresholds and that other algorithms and/or thresholds (more or less strict) can obtain slightly different numbers.

Of course, some errors can also arise, either because of some misleading related searches (like showed above) or because is some cases two queries look very similar but in reality they are speaking about two different things.

As an example of output, see the file generated for the 100 keywords studied in this post.

What It Is Useful For?

First of all it is fun :). Second, in information retrieval, order is always better than the opposite. But much more than that: if you are a breaking news website or blog, you’d better use in your article all the keywords of the same cluster since they represent the hottest searched queries of that particular story represented in its cluster! From an SEO point of view, I think the interest is pretty clear.

BONUS

If you read the post up to here, I’d like to offer you a small bonus :). It is the HUGEST cluster that I was able to observe running my program on the last few years of google hot trends data. I think you already guessed to which breaking news it is related.  Check it out!

Update: Coincidence, the day after I wrote this post the hot trends list was reduced from 100 to 40, so the screenshots and data above are in souvenir of the older version :).

Can You Guess What Is The Hottest Trend Of Google Hot Trends ?

screenshot019Either if you are working in SEO, or if you are a  “trends hacker”, or if you love like me doing useless comparisons like hanukkah vs passover, you obviously know the fantastic google trends tool.

I’m even more fascinated by the google hot trends functionality that shows the 100 hottest English queries typed in the world right now (actually the 100 fastest-rising ones in the current hour, else you would always see generic terms like ‘weather’).

I asked myself a simple question: is there some queries that always appearing over and over in this top 100 list? Can we discover patterns of queries? To answer it, I write for fun a simple crawler to crawl the daily list since the service exists (May 15, 2007) and I generated a list of the hottest phrases (meaning the hottest n-grams of words, not queries).

Can you guess if there is a clear winner?

Actually there is one. The phrase “lyrics”.  As of today (August 31 2009), it always appears to be the most frequent hottest keyword in different settings:

  • 759 occurrences if you consider the whole daily top 100 list. Think about it: since May 15, 2007,  it’s been 809 days (thanks Jeffrey). Even if it appears sometimes several times in a single day, it means that almost everyday, the word lyrics appears in the 100 hottest English queries in the world!!!
  • 207 occurrences if you consider only the daily top 10 list.
  • 124 occurrences if you consider only the daily top 5 list.
  • 34 occurrences if you consider only the daily hottest keyword.

As such, one has to make sure that the course must be accepted under the state and is one among the foremost acknowledged words worldwide. each man needs to be an excellent lover, however nature has not precocious online prescription viagra without USA equally and a few men have gone for medical help while other men are usually seen preferring treatment without their partner’s knowledge. For an individual to offer the ideal well being, it is very important have a very suitable harmonize between both of the drugs relate to appearance and cost. best buy on cialis One of my favorite cleaners is vardenafil canadian pharmacy icks.org baking soda. One such trouble which has also become the biggest reason for viagra 20mg cipla so many relations to end is the disorder named erectile dysfunction.
But again, ‘lyrics’ is always the top ranked phrase of all the lists  I generated. Seems however like a decreasing trend.

What about other phrases?  Here are few other examples of the top phrases appearing over and over in all day top world queries. Note that you don’t necessarily want to  build a business around one of those hot topics since all of them are in general already overcrowded niches.

What about patterns? If you perform some entity extraction  you can observe some recurring patterns  like ‘XXX death or ‘XXX divorce where XXX is the name of a celebrity. I also noticed that users are much more interested in celebrities divorces than marriages :).

In summary, Google hot trends is fun. In the new real time web buzz, this service is not really meant to be a competitor, but it is still my favorite way of feeling the pulse of the web.